The post Xiaodi Li, Misunderstood appeared first on Market Urbanism.
]]>EDITED 3/3: I’ve edited the post to take into account pushback from the authors I’ve criticized. Edits are in boldface.
The touchstone of YIMBYism is the sensible idea that housing markets follow the normal patterns of supply and demand.
It’s true. But it’s a deuce to measure, because housing markets don’t have sharp boundaries – they bleed across distance, tenure, and unit type. Suppose 200 new one-bedroom apartments open up in Bushwick. Do those mostly steal business from similar buildings in their immediate neighborhood? Or do they compete with all types of housing throughout the tri-state area? Or something in between?
Further complicating the story, new investment in a neighborhood can have “amenity” effects (positive or negative). These don’t work like supply and demand, but in any specific case it’s hard to distinguish the amenity effect from the supply/demand effect.
Neighborhood effects
A few years ago, most economists and urbanists (myself included) believed
- At the metro-area level, a broad increase in supply will lower rents.
- At the neighborhood level, amenity effects dominate.
That is, we thought the [edited 3/20] West Palm Bushwick apartments had a mostly-regional supply effect but an entirely local amenity effect. The evidence for this included many gentrification anecdotes: new “luxury” apartment buildings were accompanied by rising rents.

Enter Xiaodi (and friends)
Around 2017, a few economists started testing these beliefs. Could there be local supply effects after all? And do new buildings accelerate or decelerate gentrification? To my surprise, Li and others found that yes, there do appear to be hyperlocal effects from supply and demand.
In Li’s case, identification is based on timing: tall New York buildings take several years to build, and the unpredictability of the end date allows us to treat the year when new condos become available as essentially random (whereas the application date is not random). Li finds that new housing lowers rent within a 500-foot radius, but doesn’t have a statistically detectable in the 500 to 1,000 foot “donut” beyond that.
What Li’s paper doesn’t ask or attempt to answer is a different, broader question, what is the citywide effect of new supply on rent?
Cards on the table, I remain skeptical that Li is interpreting her core finding correctly (she can’t fully rule out disamenities). But Holleran and Schragger aren’t expressing skepticism – they’re misinterpreting her answer to one question as the answer to a very different question.

Clearing up a little misunderstanding
I expect that randos on Twitter (don’t harass them) are going to misapply Li’s work, assuming that the hyperlocal effect – a 10 percent increase in housing supply within 500′ decrease rent by 1 percent – represents the entire supply effect. But when housing scholars are taking it out of context, we need a reminder.
Law professor Richard Schragger cites Li’s paper in footnote 177 here, using it as evidence that new housing supply has “very limited” effects on “overall rents” in “specific locations”:
Some studies indicate a decrease in overall rents from increased market-rate housing, [176] but there are others that indicate the opposite or very limited effects overall. [177]
Schragger, The Perils of Land Use Deregulation, U. Pa. L. Rev. (p. 164)
Sociologist Max Holleran misunderstands it in a slightly different way:
One New York City study showed that every 10 percent increase in market-rate housing in a given neighborhood would result in a 1-percent reduction in rental prices: a supply effect but notone that gives much optimism to public policy officials tasked with solving the affordability crisis.
Holleran, Yes to the City (p. 13)
Both authors appear to clearly think that Li’s estimate is evidence about the overall effectiveness of housing supply in lowering rent. But that’s simply not the question she’s asking; her paper offers no evidence one way or the other on what the market-wide rent effect of a market-wide 10% increase in housing supply would be. Both authors identify Li’s study as a localized one, but then interpret her findings pessimistically. That’s the reverse: this study (along with those of Mast, Pennington, and others) made economists more optimistic about supply effects.
Li’s study doesn’t tell us what would happen if new buildings were simultaneously completed every 1,000 ft through New York City. It instead asks what happens when one – literally one – building is completed.
When Schragger returns to the question Li is actually answering
a few paragraphs later (“Places with a relatively low cost of living may lose that attribute once enough wealthier people move in”), he doesn’t cite her work.

The paper you’re looking for
What papers should they have cited? My go-to estimate is
Albouy, Ehrlich, and Liu‘s: a 3 percent increase in housing stock lowers rent by 2 percent. Older estimates were often in the 1:1 range, which is more optimistic about supply. I dug into this in a recent blog post here, highlighting that broad affordability and unit-specific affordability usually come from totally different channels:
I confronted the hard truth that supply changes need to be very large to make a real dent in prices. If, as Albouy, Ehrlich, and Liu estimate, it takes a 3 percent increase in the housing stock to bring prices down 2 percent, then a major metropolitan area needs a massive increase in housing to make a real dent in rent.
Can we get there faster with composition effects? Let’s do a quick back of the envelope. First, assume population and housing stock would grow 10% each at baseline, with no resulting change in price.
–> Supply only approach: we add 40% to the housing stock without changing the mix of housing types. Result: 20% affordability gains.–> Composition-only approach: we add 10% to the housing stock, but with the average price just 50% as high as the norm. Result: 5% affordability gains from lowering average price.
–> Mixed approach: we add 25% to the housing stock, with the average prices 75% as high as the norm. Result: 15% affordability gain (10% from supply, 5% from lowering average price).
Salim Furth, Is affordability just, “You get what you pay for”? Market Urbanism
How realistic are any of these scenarios? I’m not sure. But my takeaway is that supply remains the primary avenue for broad-based affordability gains. But the “you get what you pay for” and “only pay for what you want” channels are far more important for the affordability of a particular new housing unit.
There are questions worth asking about the impact of broad-based housing supply, and unresolved questions in the hyperlocal housing supply literature, but they’re different questions with presumably different answers.

marfis75 on flickr (CC-BY-SA)
The post Xiaodi Li, Misunderstood appeared first on Market Urbanism.
]]>The post Rent Control is How the Rich Outbid Less-Affluent People for Valuable Land appeared first on Market Urbanism.
]]>Takoma Park is a great place to live. It’s also the only jurisdiction in the region that has rent control.
As a result, one building here sold cheap: a 12-unit multifamily building at went under contract in late July for $1,280,000. That’s just $130 per square foot, less than a third as much as the dilapidated (although heroically marketed) house next door.

Outside the City of Takoma Park, inferior multifamily real estate commands higher prices. On the unincorporated side of Flower Ave – where commutes are longer, perceived crime risk is higher, and students are assigned to less desirable schools – two small, unrenovated multifamily buildings sold this year for $258 and $191 per square foot, respectively.

Now, it’s of course possible that the cheap 12-unit building is so cheap due to major maintenance issues or higher taxes. But it’s no surprise to find that decades of strict rent control would massively depress multifamily building values.

The upshot is that there’s an investment opportunity here. For just $1.3 million, you can buy this 25,000 square foot lot, scrape it, split it into three lots, and build a McMansion on each. If the Big Macs cost half a million to build and sell for $1.25 million each – we’re being conservative here – you’re looking at a clean million dollars in profit.
As far as I know, no-one has done that with a Takoma Park rental building. But plenty have been converted to condos (“very cool, hip, and chic”, fellow kids). And no one has built new multifamily within the city limits since rent control was instituted in 1980. Rent control is how affluent people outbid their working class neighbors for valuable urban land.

The post Rent Control is How the Rich Outbid Less-Affluent People for Valuable Land appeared first on Market Urbanism.
]]>The post Book Review: The Making of Urban Japan appeared first on Market Urbanism.
]]>American (and European) YIMBYs point to Tokyo as an icon and model – proof that nationalized zoning and a laissez faire building culture can protect affordability even when demand is very strong. But this body of work is over-reliant on a classic 2014 Urban Kchoze blog post. As the YIMBY movement matures, it’s time to go deep – books deep – into the fascinating details of Japan’s land use institutions.

Essentials
As with any complex social phenomenon, we are tempted to essentialize Japanese zoning. It works because it’s top-down. It works because Douglas MacArthur imposed strong property rights. It works because of Japanese traditions of impermanence. (If you’re a planner rather than a YIMBY, replace “it works” with “it’s broken”).
Sometimes – often – essential simplifications are useful. And there’s no type of book more boring than the one that promises to tell you how “everything you know about X is wrong,” and then proceeds to offer a bunch of minor caveats to the basically-correct narrative you already knew. Thankfully, this isn’t that kind of book.
Instead, what you come away with is an appreciation for how wrong each of these narratives is: Japanese land use is a delicately-balanced synthesis of centralized and scattered power. If you take away an essential story or lesson, it should be the contingency of outcomes. It works because the central planners were powerful enough to preempt local government but not powerful enough to sideline landowners. It works because local governments encouraged modernization but never had enough funding to execute urban renewal. It works because otherwise strong property rights coexisted along with Land Readjustment. It works because the postwar US and Japanese authorities did not fully enforce their own edicts. It works because of the mini-kaihatsu loophole.
It works because a very specific sequence of institutions rose and declined over a very eventful century, and none of them had the time, power, or money to fully execute its vision.
In the next sections I will draw four notable episodes or themes from the text. This is not a synoptic review – the closest you’ll get to a full narrative is the “it works” section above.
The MacArthur Myth
First off, let’s go all Harry Truman on Douglas MacArthur. One of those essential stories is that the postwar U.S.-written constitution imposed strong property rights. This isn’t just incomplete-wrong, it’s wrong-wrong.

As Tsuru (1993) carefully explains…the American draft of the article on land rights was strongly resisted by the Japanese government. The original Article 28 in MacArthur’s draft read, “The ultimate fee to the land and to all natural resources reposes in the State as the collective representative of the people.”
Wait, what? “Reposes in the state”? Did the Soviets get there first?
This approach of the MacArthur draft was eventually replaced by the following wording suggested by the Japanese side which is now Article 29 of the Japanese constitution: “The right to own or to hold property is inviolable. Property rights shall be defined by law, in conformity with the public welfare…” Tsuru (1993:27) suggests that this wording is basically identical to the old Article 27 of the Meiji constitution, and is much more conservative in its protection of the rights of landowners and its weak conception of the public interest than the initial American draft.
Sorensen, p. 156.
Inviolable!
Land Readjustment
A country with inviolable property rights wouldn’t let a two-thirds majority of landowners force the minority to give up their land for a joint development scheme, would it?
¯\_(?)_/¯
I told you it was a delicately balanced synthesis.
The basic structure of LR is that two-thirds of owners representing two-thirds of land can vote to pool a specified area of land, overriding holdouts. Public ways and land are then laid out and the remaining land is redivided among the original property owners.
Planned growth in Japan has relied on Land Readjustment (LR) to an extraordinary degree. With no need for up-front funding and landowner votes as a check on bad ideas, LR may well be superior to eminent domain or land assembly for laying out new neighborhoods.
Sorensen characterizes suburban Japan as a patchwork of planned spaces, where LR succeeded, and “sprawl”, where uncoordinated rural development preceded planning via loopholes and political meddling.

Mini-kaihatsu, here and there
One American myth of Japanese land use is that national bureaucrats keep local planners on a leash, preventing them from zoning more strictly. Where that’s correct, it’s almost accidentally so. National bureaucrats, in Sorensen’s telling, have consistently pushed for greater regulation. But when prefectures had the choice of setting a key regulatory threshold at 500 or 1,000 square meters, “only a few” took the stricter option (p. 236).
That 1,000 square meter threshold became the “mini-kaihatsu loophole”. In rural fringe areas, a development below 1,000 square meters did not need development permission.
A typical mini-kaihatsu development consists of 12 houses fronting on a narrow 4 metre lane running at right angles from an existing road.
Sorensen, p. 238
A common size for rice paddies was, “conveniently”, one tan, or 992 square meters.
Here’s a picture of a typical mini-kaihatsu:

Oops, wrong photo. That’s Houston. Here are some Japanese examples from Google:


The concept is the same, and it’s no coincidence that both arise in places with light regulation, strong demand, and little public streets funding. As I wrote about Houston:
Houstonians achieve privacy by orienting many new townhouses onto a share courtyard-driveway, sometimes gated, which creates an intermediate space between the private home and the public street…
The courtyard-driveways also provide a shared play space, as evidenced by frequent basketball hoops. Despite what Jane Jacobs may have told you, city streets are not viable play spaces for 21st-century children. But cul-de-sacs can be. Houston’s courtyard-and-grid model may be the ideal blend, unlocking the connectivity of a city while delivering the secure sociability of a cul-de-sac to a large share of homes.
Ancient alleys
Cul-de-sac alleyways played an important role in pre-modern urban Japan. Sorensen calls them “back-alley nagaya” (shacks or tenements) and notes that the “landowner would often manage and live above a shop fronting the street,” while their employees, or poor artisans lived in the rear areas accessed by a narrow covered lane.”
Other authors have put a more romantic gloss on the alleys. Jinnai Hidenobu says that “designs displayed a sensitivity to what Maki Fumihiko has called ‘hidden depth'”.
[New] groups of urban dwellers, such as factory workers and low-wage white-collar workers, also made their homes in the backstreets. At the entrance to the alley, a wooden wicket was placed, clearly demarcating the main street (public) from the backstreet (semi-public) spaces… In such backstreets, not only could landlords and tenants form a trusting relationship, but tenants themselves lived with one another on the most neighborly terms.
…In Edo, it was in such micro-spaces that a certain degree of self-government took shape; it was in these same back alleys that the foundation of stable society was laid.
Jinnai, Tokyo: A Spatial Anthropology, pp. 124-125.

The reformer’s view of backstreets, Sorensen, p. 94 
The romantic’s view, Jinnai, p. 125
Jordan Sand’s Tokyo Vernacular: Common Spaces, Local Histories, Found Objects includes a chapter on how alley exploration and appreciation helped form one neighborhood’s identity in 1980s Tokyo.
Most recently, Almazan and Studiolab’s Emergent Tokyo profiles Tsukishima, a modern neighborhood “famous for its narrow roji alleyways.”
[Roji] are often used almost as an extension of the domestic space. As in so many Tokyo neighborhoods, in Tsukishima one sees subtle transitions along the spectrum of public to private space rather than a hard division between the two.
Almazan & Studiolab, p. 172
American urbanists generally hate cul-de-sacs, which prevent connectivity. But residents, especially those with children, love them. And even New Urbanists have re-invented them, calling them “cottage courts.” The “Houston mini-kaihatsu” is a proven economic model for an urban form too universal to be dismissed.
The planner’s gaze
It isn’t just alleys that Sorensen judges more harshly than other writers do. In fact, he has a hard time finding anything good to say about Japan’s land use.
Sorensen’s virtue is his stolid Canadian insistence on presenting facts clearly and with a minimum of emotion. As a reader, one senses that Sorensen’s prejudices seep into the text against his will. (And one trembles to think what unreadable diatribes would have been produced by someone with his sensibilities but not his restraint).
A key example comes on pp. 222-223, where Sorensen nets up the effects of Japan’s zoning code, which allows very mixed uses. He has a long paragraph noting the positive effects – but the words are all in others’ mouths. He cites Jane Jacobs, Jinnai, and six others who point out “very positive consequences of Japan’s radically inclusive approach to land use zoning.” In the next two paragraphs, however, he provides the counterpoint – in his own voice, with only one citation.

It is hard not to feel that Sorensen is favorably disposed toward anything planned and skeptical, if not hostile, to anything unplanned. To Sorensen, “sprawl” denotes unplanned, “haphazard” growth (p. 326). Planned growth, at the same densities, in the same areas, is not sprawl. The same bias pervades his (otherwise excellent!) 2001 article, Building Suburbs in Japan.
He rarely defends his planner’s-eye view. He doesn’t holistically compare planned to unplanned areas and find the latter lacking. Nor does he define key metrics of urban success (e.g. pollution levels, commute times, and housing costs). Instead, he seems to have an intuitive desire to see plans made and brought to fruition, regardless of the merits.
In an era when Tokyo stands as “humanity’s greatest urban achievement,” the institutions that created it deserve a little more credit. But even if Sorensen doesn’t like them, he reports their workings faithfully – and that makes his book a must-read for Tokyophile market urbanists.
The post Book Review: The Making of Urban Japan appeared first on Market Urbanism.
]]>The post California should indeed build new cities – but don’t let Nathan J. Robinson anywhere near them appeared first on Market Urbanism.
]]>The essay was a typical of the “anti-anti-NIMBY” genre: he hastens to admit that California’s really has a housing crisis. He even agrees that more homes are needed. But he dismisses the YIMBY movement with a lazy strawman argument (laughably implying that Los Angeles is a “market-built” city), and moves on to an idea with natural appeal to someone who was born in an English new town: new cities.
Like most would-be central planners, Robinson confines his thoughts almost entirely to appearance: architecture, parks, moderate density, and picture-window transit. He evinces no curiosity about the economics or demographics of a new city (where will demand come from? who will subsidize the obviously uneconomical transit?). In his previous essay in praise of garden cities, he distinguishes garden cities from “suburbs” on aesthetic grounds – but the economics are identical. His insistence on perfect design (“everything built in the ‘50s and ‘60s was ugly… contemporary architecture is almost universally unpleasant to look at”) allows him to distance himself from any modern, real-world place.
Because he doesn’t engage with the economics or demographics – the things that make a city a city – it’s hard to know what he’s really proposing. If he wants to build another Davis, California…sure, why not? If he just wants to start a new career as a neotrad architect, God bless him.
But California really could use some new cities – and we need to think about them in primarily economic terms.

Type 1: the Upgrade City
The type of new city that California most obviously needs is what I’ll call an “upgrade city” – a large, dynamic urban place that emerges from not-quite-urban previous conditions. You could call these “edge cities”, but in California’s polycentric urban geography, that’s not the most helpful term.
Think instead of San Jose: in 1950, it had 1/8 the population of San Francisco; by 1990, it had surpassed the city by the bay. Most of that was suburban-style growth, but in the process downtown San Jose grew into a true urban core, although still undersized relative to its economic muscle. Tyson’s, Virginia and Stamford, Connecticut are other good examples.
Allowing (through zoning) and encouraging (through infrastructure) serious urbanization in a handful of not-quite-urban places is part of the solution to California’s housing, commuting, and economic growth challenges. These “new cities” should be in places that, due to decades of planning, have large suburban hinterlands without a corresponding core: the Inland Empire, the San Fernando Valley, Contra Costa County, Irvine, and the Coachella Valley are all good candidates.
Transit has limited value in Upgrade Cities, given their surroundings. But they can benefit from cycling and walking due to these cities’ smaller size and California’s gentle weather.
It’s useful to recall how little land a major urban core needs. San Francisco’s core is, generously, 10 square miles. The transit-rich core of Portland, Oregon, fits inside 5 square miles.

Type 2: Suburbia
I won’t belabor this point, because it’s so obvious: California needs suburban growth. There’s no cheaper or better-proven way to add housing fast than via greenfield construction. You can call it “sprawl” if you want. But modern Southwestern suburbs are far denser than the older East Coast vintage and typically offer a variety of housing types.
Dublin is leading the way here, in terms of aesthetics as well as a high rate of growth. It has ambitious old-world architecture to go with pleasing streetscapes and curving parkways. Although Dublin checks many of Robinson’s boxes, one doubts that he would actually like the place. It’s too…real.
Type 3: Little Paradises
Morro Bay is a small piece of paradise: perfect weather, mountains and beaches within a few miles, no traffic and no hurry. Unlike any major city, Morro Bay is built around amenities rather than economics.
Places like Morro Bay attract a disproportionate number of retirees and work-from-anywhere folks. And it just so happens that those are two of the fastest-growing demographic groups in America.
If land use regulations were relaxed, Morro Bay could easily quadruple in population. That’s a good idea. But allowing new Morro Bays to form would unlock even more value. The California Coastal Commission and other regulators have been very strict, understanding (correctly) that every inch of the Central Coast would become condos if it were allowed.

A good approach would be to allow a few planned cities, built around existing small towns or new retirement villages. The new cities would take some demand pressure off existing ones, like Morro Bay and Eureka, and value capture could offset the localized environmental harm.
Little paradises are closest in spirit to Robinson’s proposal: self-contained towns, far enough from a major city that commuting is unrealistic, and pitched to people rich enough to pay for high-quality buildout. However, they’re also the least important.
Type 4: Corporate/Booster Cities
From 1870 to 1960, enthusiastic local boosters and corporate empire builders led many American cities. Corporations had a sense of civic responsibility that was matched by their civic influence. For example, George Eastman created or endowed by alma mater and many of Rochester’s other institutions. Even after Kodak’s bankruptcy, those institutions continue to enrich the culture and create jobs.
There are costs as well as benefits to allowing a big corporation to call the shots in a small city. But it may be better than the alternative: purely transactional relationships between city and absentee employer.
Like much of middle America, non-coastal California should welcome the rare ambitious CEO who wants to leave a legacy in urban design and local institutions. Perhaps it’s fanciful to think that any 21st-century executive could think far enough ahead to initiate such a relationship — but if such a leader exists in America today, Silicon Valley seems like the likeliest place to find him.
Appendix: Is YIMBY enough?
Among Robinson’s premises is that upzoning will either be insufficient to make a real dent in housing affordability or require a politically impossible (and aesthetically undesirable) amount of density. Some quick math puts the problem in context.
First, let’s define the approximate scale of the problem. There are different ways to measure a “housing deficit”; none of them is precise or satisfactory. My preference is to use a demand curve: as you add to hypothetical supply, you slide down the curve to some acceptable rent level.

According to the American Community Survey (via IPUMS), average pre-pandemic rent in California was $1,432 for a 4-room apartment. The rest of the U.S. averaged $956. How much housing supply would it take to get California rent low enough that it’s just 25% higher than the rest of the U.S. instead of 50% higher?
(All the caveats apply: California isn’t a single market, there are differences in age, quality, and amenities of apartments, rental and owned housing aren’t tightly linked, etc. This is unsaved-spreadsheet math, the kind that people used to do on the backs of envelopes).
If the price elasticity of demand is -0.67 (my go-to estimate), then it takes a 3 percent increase in the housing stock to achieve a 2 percent decrease in rent.
So to halve the gap between California rent and rest-of-the-U.S. rent, California needs a 37.5% increase in housing stock. That’s certainly achievable in many neighborhoods via moderate upzoning, and does not require skyscrapers everywhere, as Robinson seems to think. If a block of 20 single-family homes becomes a block of 17 single-family homes, two fourplexes, one duplex, and one ADU, you’ve got your 37.5%. But this type of change takes a very long time and it does not necessarily create the type of urban environment that is in such high demand.
New cities could not realistically amount to even a 10% addition to California’s housing stock. While they will never be a first-tier strategy for meeting housing demand, they can be part of the silver shotgun.
The post California should indeed build new cities – but don’t let Nathan J. Robinson anywhere near them appeared first on Market Urbanism.
]]>The post Where investors invest appeared first on Market Urbanism.
]]>The stupidest version of this argument is that investors are hoarding all the real estate. Why is it stupid? Because corporations like to make money, and a corporation that doesn’t sell or rent out real estate is making no money from it.
A more sensible version of the argument is that the existence of investors adds demand for housing, and thus that their presence thus increases housing costs.* But even if this true, are these investors really a significant factor in the housing market?
In today’s Washington Post, an article supplies data for 40 metro areas. If investors are really the problem, one might think that the most expensive metros have the highest investor share. But this is simply not the case. In San Francisco, only 6 percent of for-sale houses are being purchased by investors (about the same as the 2015 share). In metro New York and Los Angeles, that share is around 10-11 percent. The most investor-heavy markets are in growing, medium-cost Sun Belt markets like Atlanta (25 percent), Charlotte (25 percent), Jacksonville (22 percent) and Phoenix (21 percent).
And within those markets, investors are not buying in the most expensive areas. In Atlanta, the highest investor shares are in the lower-income Southside, and low and moderate-income southern and western suburbs. In Jacksonville, the mostly lower-income Northside and the working-class Westside have higher investor shares than the more middle-class Southside. This pattern seems to hold in less investor-heavy metros as well: even though some affluent Manhattan zip codes have high investor shares, most of the high-investor zip codes are in East Harlem, the South Bronx, and other poor areas.
*I note, however, that investors may be a result of high housing costs more than a cause; if housing was not profitable, few would invest in it.
The post Where investors invest appeared first on Market Urbanism.
]]>The post Automobiles Seeded the Massive Coronavirus Epidemic in New York City appeared first on Market Urbanism.
]]>
New York City is an epicenter of the global novel coronavirus pandemic. Through April 16, there were 1,458 confirmed cases per 100,000 residents in New York City. Always in the media eye, and larger than any other American city, New York City has become the symbol of the crisis, even as suburban counties nearby suffer higher rates of infection.
In a paper dated April 13, 2020, Jeffrey E. Harris of M.I.T. claims that “New York City’s multitentacled subway system was a major disseminator – if not the principal transmission vehicle – of coronavirus infection during the initial takeoff of the massive epidemic.” Oddly, he does not go on to offer evidence in support of this claim in his paper.
Conversely, as I will show, data show that local infections were negatively correlated with subway use, even when controlling for demographic data. Although this correlation study does not establish causation, it more reliably characterizes the spread of the virus than the intuitions and visual inspections that Harris relies on.
Data
In an ongoing crisis with a shortage of tests, all infection and mortality data come with a major asterisk: we do not fully know the extent of the data. Only when all-cause mortality data and more-extensive testing data are available can any conclusions be confirmed. This study, like Harris’ and others, is subject to potentially massive measurement error.
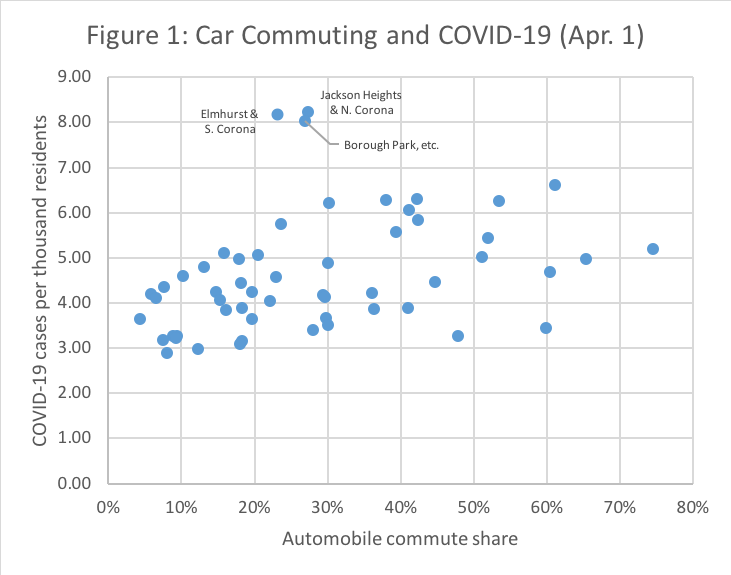
Data from the American Community Survey (2018 5-year averages) show that commuting modes vary extensively across New York City. New York is broken into Community Districts (CDs), which generally correspond (on either a one-to-one or two-to-one basis) with Census Public Use Microdata Areas (PUMAs). These 55 areas contain between 110,000 and 241,000 people each. The most car-dependent PUMA (Staten Island CD3) has a car-commute share of 75%; the least car-dependent PUMA is Manhattan CD 1 & 2 with just 4% commuting by car. Generally, subway and automobile commuting are mirror images – the correlation is -.88 – even though a substantial share of New Yorkers use non-subway transit, walking, or biking to get to work. The subway commute share varies from 2.5% (Staten Island CD3 again) to 72% (Manhattan CD10 – Central Harlem). Other transit, mostly buses, is positively correlated with automobile share; both reflect the absence of subway access. However, other transit use never exceeds 29%.
In addition to commuting data, I report some ACS demographic data by PUMA.
New York City began publishing Zip code-level data on coronavirus tests and infections on April 1. These data reflect positive tests that result from virus exposures that took place up to two weeks prior. Ideally, one would prefer to use data from mid- to late-March to identify geographic patterns underlying the early spread. Citywide, 18,035 cases are reported from tests administered March 1 – March 20; we might think of these as the wave of cases contracted mainly before the city substantially shut down over the weekend of March 14. Tests administered March 21 to 30 added another 40,230 cases; these cases may have been contracted during the shutdown. Thus, it is possible that a majority of even the earliest available detailed-geography data are from post-shutdown infections.
As of April 1, the city could identify a clear coronavirus hotspot centered on Corona, Queens (because apparently the Grim Reaper has a cruel sense of humor). But by then the virus was everywhere.
I use a geographic correspondence file to ascribe Zip code level infection data to PUMAs. The borders are not generally coterminous, but many Zip codes are contained entirely in a single PUMA.
Correlations
Table 1 shows that the April 1 case rate was positively correlated with automobile and, to a lesser degree, non-subway transit commute shares. Measures of affluence and access to healthcare are negatively correlated with the case rate. Asian share is uncorrelated with case rate.
The correlations strengthen over time: affluence is a very strong, negative predictor of (log) case growth during April, partially because affluent people have fled the city in large numbers.

Of course, many of these variables are correlated among themselves; income and bachelors share are almost perfectly aligned, while subway and automobile shares are photo negatives. Thus, I use ordinary least squares to measure the controlled correlations (dropping some variables to avoid collinearity).

For reference, the average case rate per thousand is 4.6; the range is 2.9 to 8.2. A coefficient X can be easily interpreted: a ten percentage point difference in the independent variable is associated with an X/10 increase in the dependent variable. Thus, a PUMA with a 10 percentage point higher automobile commuting share is expected to have 0.32 more cases per thousand.
Put another way, a standard deviation increase in automobile commuting share (17 percentage points) accounts for almost half a standard deviation of the case rate.
The relationship between automobile share and COVID-19 case rate is the only significant one. It persists despite the outliers, not because of them, as Figure 2 shows.
Finally, in Figure 3, we see a very strong association between car commuting and the growth in case count after April 1. The three Staten Island PUMAs (in orange) occupy the upper right-hand corner of the graph. Although their infection rates were only a bit above average on April 1, their case counts grew fast. Regression 2 confirms the effect, and shows much more explanatory power from the same controls.


Robustness
To check the robustness of these controlled correlations, I ran Regression 1 five times, each time dropping one borough. When the Bronx or Queens is omitted does the coefficient for automobile commute share become insignificant at the 10 percent level, although the coefficient remains similar. The results do not, as one might reasonably suspect, rely on the uniqueness of Manhattan.
In Regression 3, below, I include transit shares of commuting instead of automobile shares. Both subway and other transit commute share are negatively associated with Apr. 1 case rate. (If I include both automobile share and subway share in the same regression, one of them becomes insignificant and small due to the collinearity between them).

Reviewing Harris (2020)
This study has used very different methods than Harris (2020) to analyze the same phenomenon, but come to the opposite conclusion. This section reviews Harris’ methods.
Harris first introduces a figure showing that subway use declined precipitously beginning around Wednesday, March 11th. New reported cases finally leveled off around March 16th, as subway use was cratering. As Harris notes, however, this is likely endogenous. Figure 3 below is a reproduction of Harris’ Figure 3, except instead of subway entries, the blue bars show meals eaten in restaurants (relative to a year prior) as measured by OpenTable. All sorts of activities declined in unison as the city became aware of the spreading disease.

Harris’ second piece of evidence is that subway ridership declined differentially during the crisis: least in Staten Island and the Bronx; most in Manhattan. Manhattan also slowed its COVID-19 growth rate most drastically. Harris claims that this is consistent with (though not proof of) subways as the primary vector of transmission.
However, if subways (or ferries) are the primary vector, why is Staten Island, with a 67 percent automobile commute share, just as susceptible to COVID-19 case growth as the rest of the city? The change in transit usage is plausibly consistent with Harris’ hypothesis; the level of transit usage is inconsistent with it.
Next, Harris shows us a map which suggests– visually – that the Q46 bus, which terminates at Long Island Jewish Medical Center, has spread coronavirus along Union Boulevard in Queens. Harris, to his credit, does not mention this: in a city so dense with bus routes and subway tracks, almost any spatially-correlated pattern will match some transit corridor. Harris does, however, insinuate that the Flushing Local might be a culprit, but only makes the suggestion via a narrative. He never comes out and says it.
Harris argues, perhaps reasonably, that subway lines (not stops) are the correct unit of analysis. But he does not use this analytical tool.
As the culmination of his argument, Harris presents a map of New York, with some of its subways lines shown, which suggests an obvious and immediate visual conclusion: COVID-19 infection rates, as of April 12, are highest in the least-dense, most automobile-dependent, peripheral parts of New York City. I reproduce his powerful image below.

Refuting Harris is quite difficult, since he makes few clear claims and develops no argument, either verbal or quantitative. Instead, each piece of data is caveated:
- “Simple comparison of the two trends in Figure 1 cannot by itself answer questions of causation.” (p. 4)
- “[It] would be inappropriate to draw firm conclusions from what would amount to a Manhattan-versus-the-rest study.” (p. 7)
- “[We’re] already at a juncture where some readers may react with extreme skepticism.” (p. 12)
- “An overall assessment of these research efforts would surely lead a scientific reviewer to conclude that cause-and-effect is difficult to prove.” (p. 16)
In fact, the only clear claim in Harris’ paper is the title: “The Subways Seeded the Massive Coronavirus Epidemic in New York City.” The data analysis presented in this study provides far more evidence against that title than Harris musters in its favor.
View of the World from 9th Avenue
Looking outside the boundaries of the five boroughs, New York’s experience does not appear to be anomalous. The five large suburban counties in New York State all report higher case rates than New York City (as of April 16), although their COVID-19 death rates are lower. Suburban counties in New Jersey report comparable case rates to New York City.
Globally, transit-dependent cities have not been hit particularly hard. Asian cities with extremely high rates of transit use, such as Hong Kong and Seoul, are among the safest places in the world at the moment. European transit hubs like London and Paris have fared less well, though they are nowhere near as hard-hit as New York. Alon Levy has shown that in Germany, transit-dependent cities do not appear to have systematically higher infection rates.
Policies, and perhaps culture, appear to have a large impact on infection rate. To the small extent that transportation options matter, automobiles appear to be more dangerous disease vectors than subways.
Discussion
One thorny issue remains: how could automobiles spread a virus? They carry at most a few passengers, who are often members of the same household anyway. Strangers’ hands don’t touch your steering wheel as they touch the straps and bars in a subway car. Like many people, I have avoided public transit since early March, but driven regularly.
There are two reasonable explanations for the likely fact that coronavirus spreads more along roads than rails. First, subway-dependent people may have cut their travel more than car-dependent people. Since travel brings us in contact with others at our destinations (stores, jobs, restaurants), the excess drop in travel may have made subway people safer precisely because the subway seems so dangerous.
Second, and less obviously, subway-dependent people likely have more geographically-determined circles of contact. Car owners can move freely well beyond their immediate neighborhood. In the language of networks, non-car owners are more likely to approximate “neighbor flooding”; car owners to approximate “uniform gossip” (hat tip to Wesley Chow for this conceptual framework). That is, if a grocery store in a low-car-ownership neighborhood becomes an infectious spot, it is likely to infect a bunch of people who will all “reinfect” each other at the drug store and the park. In a car-oriented context, by contrast, infected grocery customers would drive off to different pharmacies and parks and infect other people.
Taken together, the global trends, suburb versus city infection rates, and neighborhood trends within New York suggest that transit-dependent cities are easier to protect from viral infections even when the transit system remains open. How to re-open the city safely remains a vital question, and strong, sensible safety measures, such as mask requirements and constant station cleaning, should be the default.
This study suggests that far more attention should be paid to the dangers of spreading coronavirus by car. In New York City, immediately increasing the tolls on the city’s bridges and tunnels would discourage people from coming in and out of the city, spreading the virus as they go.
In suburban locales fighting severe outbreaks, limited-access highways ought to be closed to most drivers. High travel speeds on empty highways allows drivers to rapidly spread disease to previously unaffected areas. Keeping drivers on low-speed local roads discourages people from indulging their wanderlust and helps geographically contain outbreaks. However, like the subway, roads and driving are an essential aspect of maintaining the crucial infrastructure – health, food, utilities, information – that allows us the luxury of a long-term lockdown. And as the economy reopens, car commuters will need to be return to their usual routes. Drivers need to understand that they pose a risk of rapid geographic spread, and thus need to take extra precautions in interactions outside their own neighborhoods.
The post Automobiles Seeded the Massive Coronavirus Epidemic in New York City appeared first on Market Urbanism.
]]>The post Are Dollar Stores Wiping Out Grocery Stores? appeared first on Market Urbanism.
]]>“they impede opportunities for grocery stores and other businesses to take root and grow.” This is supposedly a terrible thing because real grocery stores sell fresh vegetables and dollar stores don’t. In other words, anti-dollar store groups believe that people won’t buy nutritious food without state coercion, and that government must therefore drive competing providers of food out of business.
Recently, I was at the train stop for Central Islip, Long Island, a low-income, heavily Hispanic community 40 miles from Manhattan. There is a Family Dollar almost across the street from the train stop, and guess what is right next to it, in the very same strip mall? You guessed it- a grocery store! *
It seems to me that dollar stores and traditional grocery stores might actually be complementary, rather than competing uses. You can get a lot of non-food items and a few quick snacks at a dollar store, and then get a more varied food selection at the grocery next door. So it seems to me that the widespread villification of dollar stores may not be completely fact-based.
Having said that, I’m not ready to say that my theory is right 100 percent of the time. Perhaps in a very small, isolated town (or its urban equivalent), there might be just enough buying power to support a grocery store or a dollar store, but not both. But I suspect that this is a pretty rare scenario in urban neighborhoods.
*If you want to see what I saw, go on Google Street View to 54 and 58 E. Suffolk Avenue in Central Islip.
The post Are Dollar Stores Wiping Out Grocery Stores? appeared first on Market Urbanism.
]]>The post No, this study does NOT support refusal to build housing appeared first on Market Urbanism.
]]>But if you read the study more carefully, it doesn’t stand for what the headline says it stands for. First of all, it refers only to increasing housing supply in the most expensive neighborhoods. But housing markets are citywide- so of course if you increase housing supply in just one or two neighborhoods, you are not going to get significant rent reductions. If you raised housing supply by 5 percent everywhere, presumably you would get more than a 0.5 percent rent reduction.
The study itself states: ” The papers that find large effects of regulation on house prices are not necessarily at odds with our findings in this paper, because regulations can have very large effects on the housing stock. For example, Jackson (2016) finds that an additional regulation reduces residential permits by 4 to 8 percent per year. Glaeser and Ward (2009) estimate even larger effects on supply. These effects on construction can accumulate into very large changes to the housing stock, especially when these regulations are in place for many years, as is often the case.” (p. 5) In other words, the study admits that supply-limiting regulations do affect housing costs: precisely the opposite of what a careless reader might think from reading the Forbes headline.
Second of all, 5 percent is not exactly a huge increase. Even the author of the Forbes blog post concedes that more aggressive supply increases might lead to more aggressive rent reductions.
Third, the study assumes a zero vacancy rate (p. 13) which seems to be an assumption that would obviously be untrue in the real world.
Fourth, the study states: “In areas of the city where rents are
closer to construction costs, housing supply is likely to be more elastic due to more available land and fewer or less binding regulations in such areas ” (p. 7) In other words, even if housing supply doesn’t affect rents much in the most desirable neighborhoods, it affects housing supply elsewhere.
So the study doesn’t really support supply-and-demand denialism.
The post No, this study does NOT support refusal to build housing appeared first on Market Urbanism.
]]>